A small population with a mind-boggling array of ethnic and cultural groups
Credit: Scott Wishart.
This is a post by Robert Stanton, a Community Research Fellow with the Social Research and Planning Council (SRPC). This post is part of Painting by Numbers: Using Data to Explain Ourselves, an ongoing series by Robert about the various ways data can illuminate local issues.
This time on Painting by Numbers, as we continue to look at what data can tell us about our community, we shall consider a few aspects of our ethnic and cultural heritage.
Huron and Perth counties form a region of incredible ethnic and cultural diversity. Those completing the 2021 census identified 147 different groups, from Acadian to Zimbabwean. Our heritage is also rich in complexity. A group may contain many people, and a person may be connected to multiple groups. All of these connections influence our sense of who we are individually and collectively.
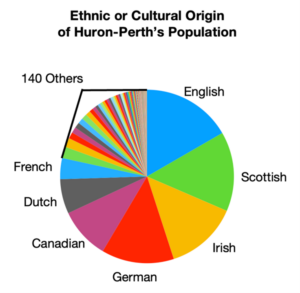
Figure 1. Credit: Robert Stanton with data from Statistics Canada
Included, of course, are those with Indigenous ancestry. Members of First Nations, Métis, and Inuit cultures are all present in our region — a small but profoundly important part of our community.
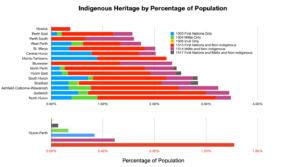
Figure 2. Credit: Robert Stanton with data from Statistics Canada
Huron-Perth is also home to numerous racialized groups, so-called because they are sometimes treated differently (often negatively) based on perceived racial characteristics, such as skin colour or ancestry. Within the region as a whole, at the time of the 2021 census these groups made up just over 4% of the population. While that is still a relatively small proportion, it is up from just under 1.8% in 2001.
The two charts in Figure 3 show the distribution of these groups, by group and by subdivision, at either ends of this 20-year period. In both charts, there are marked differences in the degree of change experienced over time – by specific groups and by specific subdivisions. In both cases, there are some 2021 values that are multiples of their 2001 equivalents.
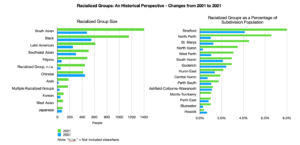
Figure 3. Credit: Robert Stanton with data from Statistics Canada
Religious faith is also an aspect of Huron-Perth life in which some small groups exist alongside much larger ones. Christian and secular groups account for all but 2% of the population. Consequently, special care is needed to recognize the small but valued presence of numerous religious minorities within our region.
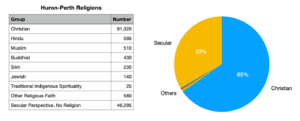
Figure 4. Credit: Robert Stanton with data from Statistics Canada
Recognizing another related aspect of our diversity, the census also gathered information on languages learned and spoken as a mother tongue. Figure 5 shows the number of such languages to be found across Huron-Perth and its subdivisions. In all, 72 languages were reported. The pattern of distribution was broadly similar to the spread of population, observed earlier in this series. North Perth, however, appeared to punch above its weight, possibly as a result of its exceptional growth in population in recent years, also as discussed in previous posts.
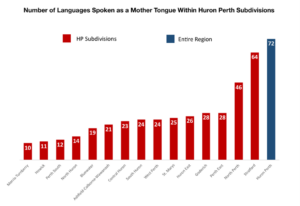
Figure 5. Credit: Robert Stanton with data from Statistics Canada
In terms of what languages are spoken, Figure 6 shows those spoken by more than 100 people within the Huron-Perth region.
In order for Serbo-Croatian, with 105 speakers, to appear as more than a dot alongside the 125,000 English speakers, a logarithmic scale has been used. Each increment on the (x-axis) scale is ten times the previous one.
The region’s European heritage is very evident from this list, not least through the presence of so many forms of German: German, Pennsylvania German, Plautdietsch (Mennonite Low German), Low German, and Swiss German. However, there are 32 different languages on this list, from many parts of the world.
The Australian writer Clive James once observed that in the Olympics the USA won as many medals as the rest of the world put together, perhaps because it was the rest of the world put together. On that basis, perhaps Huron-Perth should consider entering the Olympics!
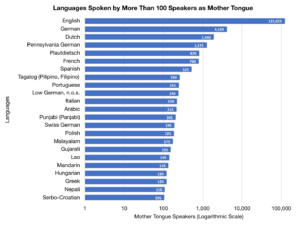
Figure 6. Credit: Robert Stanton with data from Statistics Canada
Moreover, such diversity looks set to increase. Huron-Perth has a long-established history of inward migration, from within Canada and from abroad, and that is set to continue.
For an historical perspective on immigration, Figure 7 shows, for each subdivision and for the region as a whole, the decade of arrival of those Huron-Perth immigrants who came to Canada after 1980 – all as reported in the 2021 census. The overall pattern (seen in the lower chart) is that of a steady but not spectacular increase over time – especially so when recognizing that the latest “decade” is actually one year longer than the others.
Once again, among the subdivisions there is considerable variation. Indeed, some have experienced declines in their intake over time. In terms of relative growth, North Perth once again stands out. In the 1980s, Stratford appears to have had multiples of North Perth’s intake, but by the 2010s, that was no longer the case. Indeed, the numbers from 2001 to 2010 were higher for North Perth than for any other subdivision.
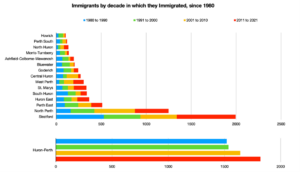
Figure 7. Credit: Robert Stanton with data from Statistics Canada
The census also recorded the countries of birth of the immigrant population, which accounted for a little over 11,500 people at that time. While Europe, the US, and Mexico predominate, there are 42 countries mentioned in all, plus 5 unspecified regions: Europe, Asia, the Americas, and Oceania. One can only speculate how long the list would be if these regional groups were separated into their constituent countries.
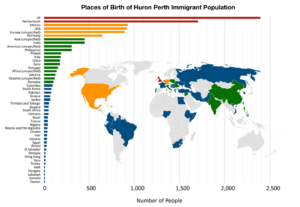
Figure 8. Credit: Robert Stanton with data from Statistics Canada
For another, more contemporary perspective on new intake, data available from Immigration, Refugees and Citizenship Canada (IRCC) provides insight into the admission of new permanent residents into Huron-Perth and its subdivisions.
A significant increase in numbers since COVID to support Canada’s economic recovery is clearly evident in Figure 9. The numbers have remained relatively stable since then, however. The reduction in 2025 is at least in part due to the November and December figures not being available at the time of this analysis. The 2025 value therefore represents a 10-month total.
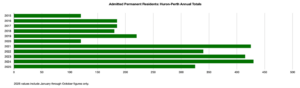
Figure 9. Credit: Robert Stanton with data from IRCC
In terms of distribution across the region, Stratford and North Perth have accounted for over half the intake since 2018, and the latest figures suggest their share may now be closer to two-thirds.
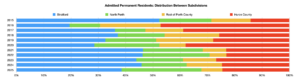
Figure 10. Credit: Robert Stanton with data from IRCC.
Prospectively, the federal government has announced targeted reductions within its 2026-2028 Immigration Levels Plan. The targets for 2026, compared to 2025, include 4% fewer permanent residents, 37% fewer temporary workers, and 49% fewer international students.
That is from a national perspective, however. What these plans will mean for Huron-Perth remains to be seen. Agriculture, hospitality, and healthcare within the region have depended upon support from foreign workers, and more broadly, the anticipated growth in population is likely to depend to some degree on international immigration.
Next time on Painting by Numbers: Employment and Income.
February is Black History Month! Black History Month is an important time to reflect on progress made on Canada’s commitments towards addressing anti-Black racism and learning about the diversity of the Black Community in Canada and the legacy of Black leadership and contributions. Local events announced so far include a new exhibit at Stratford Perth Museum. You can find more information about Black History Month in Canada here.
United Insights: A Research Blog by SRPC
Subscribe to get United Insights in your inbox.
Got research-loving friends? Send them this post!
Did your research-loving friend send you this? Subscribe
Love this post? Strongly dislike it? Got suggestions? Let Us Know