
The first step to solving a chronic community housing shortage

A field of sunflowers in Perth County. Credit: Doug Gordon
Long-Term Problems, Long-Term Commitments
The market alone is unlikely to solve the housing crisis in Perth and Huron Counties. While market housing will continue to house the vast majority of Perth-Huron residents in any scenario, increased market supply will take time to improve affordability and will tend to serve higher-income residents first. Even in the long-term, we ought to expect that there is some part of the population that the market will not serve at all — especially at the needed level of affordability.
To support the hardest-hit households, an alternative is to grow our community housing stock, as recommended in SRPC’s report Our Stories of the Housing Crisis. Whether built by governments or non-profits, community housing units do not go to the highest bidder, but to the many households that struggle to compete in this market.
This is not a new concept. Governments and non-profits all over the world build and operate housing. Canada and Ontario, too, have a history of developing community housing. Most of the community housing that our towns and cities rely on today was built decades ago in a period when both the federal and provincial governments invested consistently in community housing.
Here’s some historical context: the 663 rent-geared-to-income units owned by the Perth and Stratford Housing Corporation were built between 1953 and 1979 — an average of around 25 units a year. If we had continued building at that pace from 1980 to 2025, Perth County would have almost 700 more community housing units today.1 Instead, government investment in community housing practically ended in the mid-90s, and the file was eventually “downloaded” to municipalities, who have the least fiscal capacity to tackle it. As a result, much less new community housing was built in the past three decades.
Governments and society more broadly have begun to reconsider. Federal support for community housing has increased through the 2017 National Housing Strategy and the new housing agency Build Canada Homes. Local municipalities in both counties have pursued new projects with provincial support: County of Huron has built 66 units in Goderich and Exeter and the City of Stratford has built 62 new units. United Way Perth-Huron has started a new housing non-profit, United Housing, with projects underway in North Perth, Stratford, and South Huron.
Every completed project is a significant achievement. But will these projects create momentum for a community housing renaissance? The need for new community housing does not stop and start the way our public investments have, and dealing with it on an inconsistent, project-by-project basis seems ineffective. As the population grows, there is a constant, ongoing need for new community housing and only an ongoing, long-term development strategy will meet the challenge.
We cannot hope to define such a strategy in this post, or even offer a precise target to work towards, but we can help the conversation by giving a sense of the scale at which we should be thinking.
Multiple indicators point to significant unmet demand for affordable and supportive housing in Perth-Huron. This is pre-existing demand, not future demand. Even leaving population growth aside, there is abundant need to be met.
The Scale of Homelessness
Intuitively, one place to start is with the households known to be experiencing homelessness in our community. There have consistently been just under 300 households (most of them single individuals) experiencing homelessness in the Huron-Perth region throughout the past year (roughly half in each county). This provides a helpful snapshot of immediate need, if not a complete picture of a fluid situation.
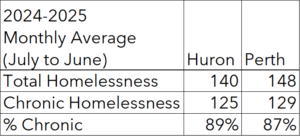
Source: County of Huron, City of Stratford
Most of these households have been “chronically homelessness,” meaning they have been experiencing homelessness for an extended period. This suggests that, for one reason or another, the housing market is not meeting their needs. It may take community housing to provide these households with permanent and stable homes.
Depending on your perspective, these numbers might seem manageable. (They are certainly much more approachable than the numbers we will share in the next section!) However, one complication with meeting this goal is that many of these households may need more than cheap housing.
Not only are many households on the By-Name List chronically homelessness, many of them are also “high acuity.” That means they’re facing multiple challenges to overcome or cope with alongside the need for housing. This can include drug addiction, mental illnesses, disabilities, and harmful relationships. These challenges increase the risk of homelessness and are often significantly amplified by homelessness itself (which can involve chronic sleep deprivation, shame, isolation, and exposure to violence and the elements). A vicious cycle is then in motion.
Many households experiencing homelessness will be able to return to permanent housing once it is available with minimal supports. However, some may require supportive housing, meaning housing with resources (medical staff, social workers) on site. Therefore, these homelessness numbers might better represent the need for supportive housing, in particular. This poses an extra challenge, since specialized knowledge and additional funding (always scarce) are needed to put the “supportive” in supportive housing. Yet if this is the true scale of the supportive housing need, this is the scale at which we should think.
The Scale of Core Housing Need
There are also a great many local households that are housed but still struggling in this housing market. This is part of what has made the “housing crisis” such a universal concern — housing costs have become unaffordable for many households who otherwise perceive themselves to be doing well.
Some of these households are experiencing “Core Housing Need.” A household is in Core Housing Need if two conditions are met. Firstly, their housing has to be at least one of the following: unaffordable, inadequate (run-down), or unsuitable (too small). Secondly, their household income has to be too low to afford adequate and suitable housing elsewhere in their community. These households are stuck with bad options — their current housing doesn’t work and they can’t afford an alternative.
This gives us another natural starting point for our community housing goals. In fact, our data on Core Housing Need is pulled from the University of British Columbia’s Housing Assessment Resource Tools, which suggests Core Housing Need as a proxy for current housing deficits. This is not universally accepted; economists Watson & Associates, for instance, use a stricter standard of “Severe” Core Housing Need in their Perth County Housing Needs Assessment, ultimately producing a smaller number for existing need.
Core Housing Need reveals an entirely different scale of problem: not hundreds of units, but thousands.
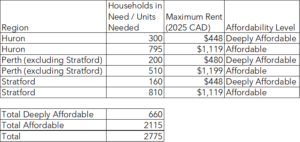
Source: Housing Assessment Resource Tools
Helpfully, the Housing Assessment Resource Tools break down Core Housing Need data by income level. That gives us a greater sense of what level of “affordability” we need to be thinking of. It is plausible that the housing market may be able to provide small units at $1,200 per month (likely older units). Units at that rate have been available in recent memory. It seems much less likely that they would provide any unit at $500 or less per month when even single rooms can rent for more. If the point is to make progress on housing affordability, community housing needs to serve at least some of these households.
Remember, we are not yet looking at new need from population growth — we are simply illustrating our present deficit. Recovering from a 30-year development lull will require a catch-up period before pace of development can return to the pace of population growth. Numbers at this scale require advocates and planners to think over many years. Over a decade, building all of these deeply affordable units would mean delivering 60-70 units a year — an unprecedented pace of development, just to catch up!
Again, this is only meant to get us thinking at scale. Further thought is required to decide how many of these units are the realistic responsibility of the community housing sector as opposed to the private market.
The Scale of International Averages
Finally, another way to set a target for community housing is to seek out some standard for comparison. This method is not directly tied to observed need but helps us understand what might be possible.
One commonly proposed benchmark is that we should have as much community housing, relatively speaking, as similar countries. Specifically, across the Organisation for Economic Co-operation and Development (OECD) countries, community housing makes up an average of 7% of the housing stock.2 The “average” here may be somewhat misleading: it is pushed up by countries with unusually large community housing stocks, like the Netherlands, which has the most in the OECD at 29%. Canada, at around 3.5% community housing, is just below the OECD median,3 meaning if you line up all the countries from most to least social housing, Canada is close to the middle, even if it is “below average.”
Still, countries like the Netherlands, Austria, and Denmark show us it is possible for community housing to play a much greater role in a country’s housing system. The National Housing Council, Canadian Alliance to End Homelessness, and Community Housing and Renewal Association have all recommended meeting the OECD average for relative size of community housing stock — growing from 3.5% to 7%.
We can look closer at the Netherlands to understand what this could involve. Dutch social housing is “built, owned, and managed by a robust and decentralized network of 284 non-profit housing associations.” Surely the Governments of Canada and Ontario would be relieved to hear that “the housing associations do not receive any direct subsidy to fund their activities. They are able to manage and maintain their housing stock on a revolving fund from rental income and they make use of long-term loans to fund construction projects.”4
The Netherlands also shows us that community housing doesn’t fix everything. The country is still experiencing a “next-level housing crisis,”5 with long waits for community units. Nevertheless, the community housing in the Netherlands shelters many residents from the volatility of the market — and such a robust community housing sector presumably makes it easier to expand stock when needed.
As of right now, we don’t have perfect information on the size of the local housing stock, but a rough estimate tells us that Huron County and Perth County outside of Stratford have about 2% community housing, while Stratford has around 5% community housing.
Here’s what a rough calculation suggests would be needed to reach 7% community housing, assuming the 2021 total housing stock and all new builds:
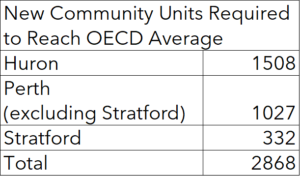
Source: United Way Perth-Huron calculations, data from City of Stratford/County of Huron/StatsCanada
As you can see, this is within the same order of magnitude as the Core Housing Need numbers. Are these numbers realistic as a basis for our community housing goals? That remains to be seen. Once again, what matters is that we are thinking and planning at approximately the right scale.
Moving Forward with Scale in Mind
These approximate calculations give us a sense of scale, but we could certainly go further to create a more precise target for community housing development. This would involve, for one thing, accounting for future need based on population projections.
We are not the only ones tracking this problem, of course, and consultants and economists have created “Housing Needs Assessments” (or similar documents) for local municipalities. These reports vary in what they include. For instance, Huron County’s Population and Housing Projections Study does not consider pre-existing housing need, while Perth County’s Housing Needs Assessment (by the same economists) calculates existing housing need from Severe Core Housing Need and active homelessness. A forthcoming Huron County Housing Needs Assessment may include different information to inform the county’s Housing and Homelessness Plan. Stratford’s Housing Needs Assessment considers suppressed household formation, general Core Housing Need, and homelessness, but doesn’t provide much in the way of conclusive numbers.
Suppressed household formation raises an interesting point. There are complex dynamics at play in the housing market not visible in stats like the ones above. Beyond homelessness and Core Housing Need, one might assume that the status quo is fine, and all we need to do is plan for population growth. But current household formations may themselves be shaped by existing housing deficits. Consider the many young adults living with their parents when they would prefer their own place (i.e. to “form” their own household). This so-called “suppressed household formation” may represent significant latent or “pent-up” demand in the current population, meaning projections based on population growth alone will undershoot the mark. We might also consider workers who commute into our communities, when they would prefer to live here, as part of this latent demand.
Sophisticated analysts like Canada Mortgage and Housing Corporation (CMHC) also factor in the dynamism of the market. New housing itself will change things. It may generate new demand, and it will free up other supply as residents move in and leave their old units vacant. In this way, new market-rate units may “create” affordable units, and community units may “create” new market ones. These considerations may be helpful in specifying a more precise target for new community housing.
Ultimately, precision may not be what matters. It may be more important that, after 30 years, we are no longer satisfied with sporadic and insufficient development. We are beginning to think about building new community housing at scale.
United Insights: A Research Blog by SRPC
Subscribe to get United Insights in your inbox.
Got research-loving friends? Send them this post!
Did your research-loving friend send you this? Subscribe
Citations
- City of Stratford. (n.d.). Public housing year built [Data set]. City of Stratford.
- Organisation for Economic Co-operation and Development. (2021). PH4.2: Social rental housing stock (OECD Affordable Housing Database). https://webfs.oecd.org/Els-com/Affordable_Housing_Database/PH4-2-Social-rental-housing-stock.pdf
- Unfortunately, our national community housing data is not great. A more recent estimate is 4.1%. See: Parliamentary Budget Officer. (2025, March 6). The evolution of Canada’s social housing stock. Government of Canada. https://www.pbo-dpb.ca/en/additional-analyses–analyses-complementaires/BLOG-2425-008–evolution-canada-social-housing-stock–evolution-parc-logements-sociaux-canada
- van Deursen, H. (2023, June). The People’s Housing: Woningcorporaties and the Dutch social housing system – Part 1: The history (Working Paper). Joint Center for Housing Studies, Harvard University. https://www.jchs.harvard.edu/sites/default/files/research/files/harvard_jchs_the_peoples_housing_history_van_deursen_2023.pdf
- Fuller, G. (2024, May 6). “‘Everything’s just … on hold’: The Netherlands’ next-level housing crisis.” The Guardian. https://www.theguardian.com/news/article/2024/may/06/netherlands-amsterdam-next-level-housing-crisis