
The population is aging — but not everywhere

Credit: SHS Photography
This is a post by Robert Stanton, a Community Research Fellow with the Social Research and Planning Council (SRPC). This post is part of Painting by Numbers: Using Data to Explain Ourselves, an ongoing series by Robert about the various ways data can illuminate local issues.
Last time on Painting by Numbers, we considered how the population of Huron and Perth Counties is distributed and growing. This time we are going to look at another major factor driving the needs of individuals and groups within the region: their age.
Figure 1 shows the age profile of Ontario as a whole, represented in dark red. Young children make up about 10% of the population, but they are outnumbered by adolescents and every adult group, from those in their 20s to those in their 60s. While the largest group is that of people in their 50s, it is not by much. It is notable, too, that 70-year-olds make up less than 10%, and 80-year-olds less than 5%.
By contrast, the grey lines in the background represent the subdivisions of Huron-Perth, and it is clear that they deviate markedly from the provincial picture. Some subdivisions have a significantly larger child population, as a proportion of the whole, while others show dramatically larger shares of people over 60. The age profile of the Huron-Perth region, and those of its subdivisions individually, differ from that of the province as a whole – creating the potential for some important differences in social need.
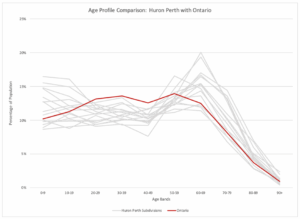
Figure 1. Credit: Robert Stanton with data from Statistics Canada
On closer examination, the subdivisions of Huron-Perth fall broadly into two categories: younger and older. Figure 2 shows the subdivisions with a younger age profile. Across the four subdivisions highlighted — Howick, Morris-Turnberry, North Perth, and Perth East — children under 10 are the predominant age group, with teenagers mostly not far behind. These subdivisions are not only the ones with the most youth, relatively speaking, they also lack the pronounced peak in senior age groups that is seen elsewhere.
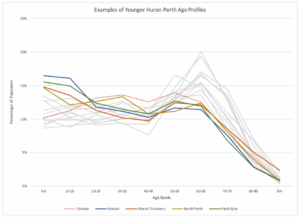
Figure 2. Credit: Robert Stanton with data from Statistics Canada
Later in this series, we’ll look at some of the factors that contribute to this type of profile, in these areas, but for now we shall settle for identifying the existence of these important deviations from the provincial pattern.
Meanwhile, at the other extreme (Figure 3), we have subdivisions such as Ashfield-Colborne-Wawanosh, South Huron, Goderich, and Bluewater (to pick just four), in which 60- and 70-year-olds predominate, and in which the 80+ are significantly more common than is the case provincially.
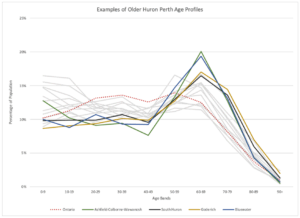
Figure 3. Credit: Robert Stanton with data from Statistics Canada
Once again, we are seeing not just minor differences between subdivisions, but large deviations that can be expected to result in quite different needs, preferences, risks, and vulnerabilities within their populations. We are also seeing how any attempt to generalize Huron-Perth collectively will inevitably overlook some important details and distinctions.
If we compare the population of those four “younger profile” subdivisions with the population in the rest of the region, we get something that looks like Figure 4.
From this perspective, we are able to see not only how the profiles of the two groups compare, but also their relative population size. The map also shows where the respective subdivisions are located within the region.
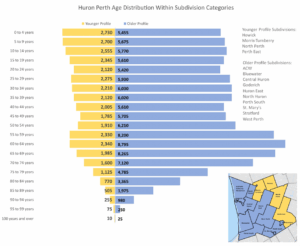
Figure 4. Credit: Robert Stanton with data from Statistics Canada
The dominance of the older profile is significant. When looking at the region as a whole, there is a risk of the older profile eclipsing the younger one. Similarly, in decision-making and resource allocation, even by and within the region itself, care is needed to avoid the dominance of the larger group overshadowing the smaller one. There is a need for appropriate balance.
Even within a subdivision, similar issues can arise. If we compare the age profiles and population numbers of Listowel and the rest of North Perth (Figure 5), we can see how two quite different profiles are not evenly balanced. Interestingly, Listowel’s profile has three pronounced peaks, featuring young children, younger adults, and seniors.
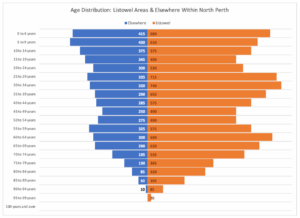
Figure 5. Credit: Robert Stanton with data from Statistics Canada
The chart below (Figure 6) compares the subdivisions of Huron-Perth with Ontario as a whole and with two local cities (Cambridge and London), with respect to the “old-age dependency ratio” – the number of seniors aged 65+ per 100 people of working age (defined as being between 20 and 64).
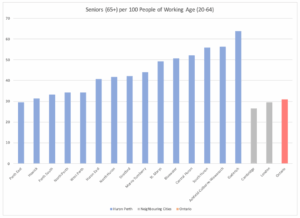
Figure 6. Credit: Robert Stanton with data from Statistics Canada
It is easy to see from this perspective how Huron-Perth might be regarded as “senior-dominated” when looked at from outside. It also shows how easy it might be to overlook pockets of the region within which a younger age profile could give rise to some different social challenges and needs.
Returning to the chart shown in Figure 4, but this time looking at it through a prospective lens (see Figure 7), we can see that the short-term future promises more of the same. Those reaching 65 in the next 10 years (from 2021) are far greater in number than those set to reach 20 over the same period.
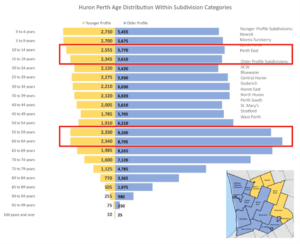
Figure 7. Credit: Robert Stanton with data from Statistics Canada
Interestingly, however, the longer-term forecast is for some change in this trend. The population projections of Ontario’s Ministry of Finance, issued in the summer of 2025, describe developments as shown in the charts in Figure 8, below.
Against a backdrop of continued population growth, as discussed in part one of this series of articles, there is an expectation of some bolstering of the working-age population – i.e., those aged between 20 and 64 – through inward migration. Over time, this is expected to slow the growth in overall average age and to increase the ratio of working-age adults to seniors and children.
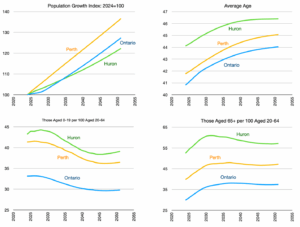
Figure 8. Credit: Robert Stanton with data from Government of Ontario
Just as notably, what the forecasts do not expect is for the figures for Huron County or Perth County to close in on those of Ontario in the foreseeable future.
Next time on Painting by Numbers: Some insights into linguistic and ethnic diversity, plus what we do for a living.
United Insights: A Research Blog by SRPC
Subscribe to get United Insights in your inbox.
Got research-loving friends? Send them this post!
Did your research-loving friend send you this? Subscribe
Love this post? Strongly dislike it? Got suggestions? Let Us Know